Real-world examples of AI predicting the future

I often get asked to help companies predict the future using AI.
While I don’t have a crystal ball to foresee black-swan like events, I can help companies forecast, prepare, and adapt – sometimes with surprisingly simple approaches.
In the first part of this post, we explored how AI can help with certain categories of prediction but still can’t give you the winning lottery numbers. Here, I will look at some concrete examples of where AI can help to manage your business by increasing the accuracy of your future models. Let’s start with the ubiquitous sales forecast.
How to lose all credibility with your leadership team
Many years ago, I was a consultant brought into a company to help improve its sales process. The sales forecast was accurate to ±350% on the last day of the quarter. In other words, the Sales Director had no idea how much business the team (of about 20 people) were going to close. That lack of clarity was hugely damaging for his reputation with the C-Suite. We implemented a new forecasting system, that increased accuracy to ±5% and was proven to be successful for the next year and a half onwards. However, the most shocking aspect of this improvement was not the increase in accuracy, but that the forecast was made on the first day of the quarter! What did we do?
What made it work: simplicity
If you think about a traditional sales pipeline, there are multiple stages with weighted probabilities, e.g. a 10% Suspect, a 30% Prospect, a 90% Procurement stage, and so on. We also hold details on which product is involved, the expected value of the sale, the account manager, geography, whether a partner is engaged, and many more values. Some sales managers use a ‘gut-feel’ indicator and ask their sales people to flag deals that they believe will happen by the end of the quarter. At the company in question, all of these factors were being used to calculate the weighted, forecasted sales value. There was too much noise, too much variability between people and teams, to really see the true picture.
Here's what we did. We asked the sales team to clean the pipe at the end of the quarter, so we started with a ‘clean’ pipeline, accurate to the best of everyone’s knowledge. Then we looked at the total gross pipeline value. For non-salespeople, that is simply the grand total of all of the potential sales deals values, not considering any other factors. We then multiplied this by a historic metric – which turned out to be 45% for quarters 1-3, and 55% for quarter 4, to give an unerringly accurate long-range forecast. Simple.
Calculating the critical historic metric
The vital number was the historical metric. To determine this, we simply looked at the gross pipeline value at the start of every quarter historically, and the actual sales total achieved at the end of the quarter, to calculate what percentage of the gross number had been delivered. Checking through the historical data, it was clear that the metric was accurate, as the results were very similar (within a few %) every time.
This is a great example of a system that is improved by simplification; removing the noisy variables to look at the key ones that matter. This was done manually at the time, but we now use AI to do this faster and more effectively, helping us to spot the key variables – provided the data is available.
That demand forecast is crazy
We recently had a customer ask us to look at improving their demand forecast. They gave us data for a handful of SKUs, going back several years, and wanted to know if we could better predict the demand for each product. The data below is simulated, rather than accurate, but take a look and see if you can guess what we said:
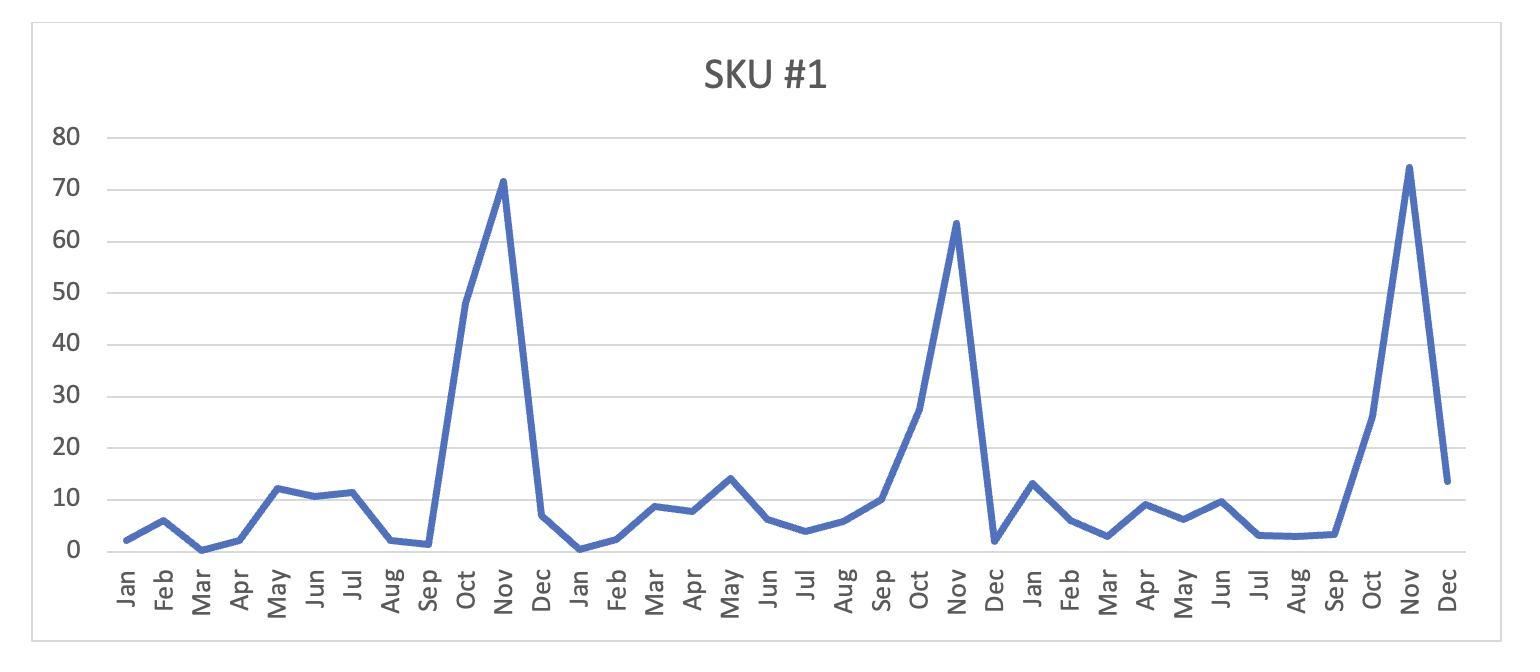
SKU #1 follows a clear seasonal pattern – think cranberry sauce in November. AI can lock onto that and make a good prediction, especially since the peak values are all similar, too.
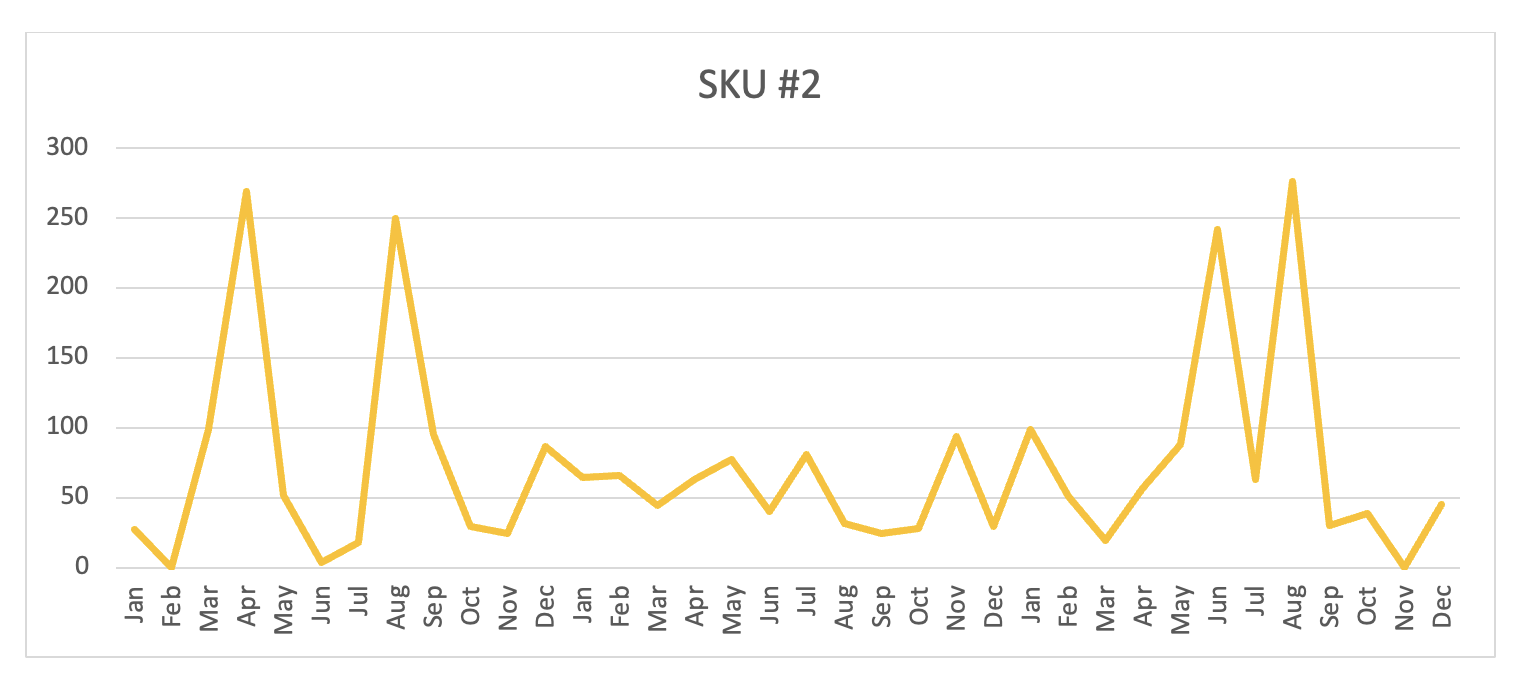
SKU #2 has no obvious pattern. It could be toilet-roll sales after panic buying from a news headline. This is where it gets interesting, and the data scientists and AI tools come into play.
Sometimes, there can be a connection between different data points held in other datasets: temperature, for example, or there might be a relationship between SKUs - everyone buys graham crackers, marshmallows, and chocolate at the same time, ready for BBQ season.
That’s where an AI can show its strength, by ingesting thousands of data points and searching for connections:
Correlation: a relationship between two variables. When one changes, the other does too. It’s important to note this may be a coincidence, or there may be another factor involved. For example, ice cream sales and shark attacks both increase in hot, sunny weather, so they are correlated, but one does not cause the other.
Causation: in this case one variable does affect another, e.g. smoking causes lung cancer, as proven with biological evidence, a series of longitudinal studies, and experimentation — not just observed correlation.
Often, we find that the data given to us by a client is not deep or broad enough to uncover these relationships. SKU #2 could be a shark deterrent with sales spiking after reported attacks. Perhaps geographic data (e.g. sales mostly happening in coastal zones) would have helped, and certainly analyzing news feeds may have been useful. However, you need to understand what data is available, and what may have an impact, as there is a cost in time and effort in processing additional datasets.
Finding patterns in data is a huge aid in improving forecasts, as are accurate historical sources. AI does a great job in this area, providing relevant data sources are available.
Scenario Modeling
The other area where AI excels is in modeling what-if scenarios to determine the best plan. For example, imagine a product that only costs a few dollars to make, has a short shelf-life, and consistent sales, but can sell in very large numbers in the right conditions. AI can help model how much of the product to keep in stock at various distribution centers, to minimize cost and maximize profit, in different situations. By assigning probabilities to these occurrences, we could make good decisions on inventory levels.
Let’s say we ran three different scenarios: one with a normal demand curve, one with a 2x seasonal spike triggered by an external event (e.g., a heatwave), and one where demand remains flat but shipping costs double. Using AI, we could simulate these conditions and stress-test different inventory strategies. It allows teams to shift from reactive planning to proactive readiness — adjusting production, stock levels, or promotions before the change in demand. What used to take weeks of spreadsheet modeling can now be done in minutes.
We’ve also seen this approach work incredibly well in pricing and marketing scenarios. Imagine a client wanting to understand how competitor promotions affect their own unit sales. AI can find subtle lagging correlations between competitor campaigns and dips in their own sales, even when the overlap isn’t immediately obvious to the naked eye. With that insight, a company can adjust their promotional calendar, pricing thresholds, and even stock levels, resulting in a measurable boost to revenue. The AI isn’t replacing their team’s instinct, rather enhancing it with evidence and speed.
Wrapping up: forecast with AI to see further
Better forecasts don’t always need more data — they need the right data, used in the right way. AI isn’t a crystal ball, but it is a sharp focusing lens that can help you see further, identify hidden patterns, and model multiple scenarios to react faster to disruptions. Whether you’re cleaning up a chaotic sales forecast or untangling messy demand data, the combination of AI and focused human judgment is incredibly powerful.
I’ve come to believe that foresight isn’t about predicting one perfect future — it’s about being prepared for several plausible ones. Risk mitigation and the ability to take advantage of unforeseen opportunities are the key. If you’re navigating uncertainty and want to sharpen your forward view, I’d love to talk.